For the Love of Anchor Charts
Posted by By Chris Schwab on Aug 7th 2019
What is an anchor chart?
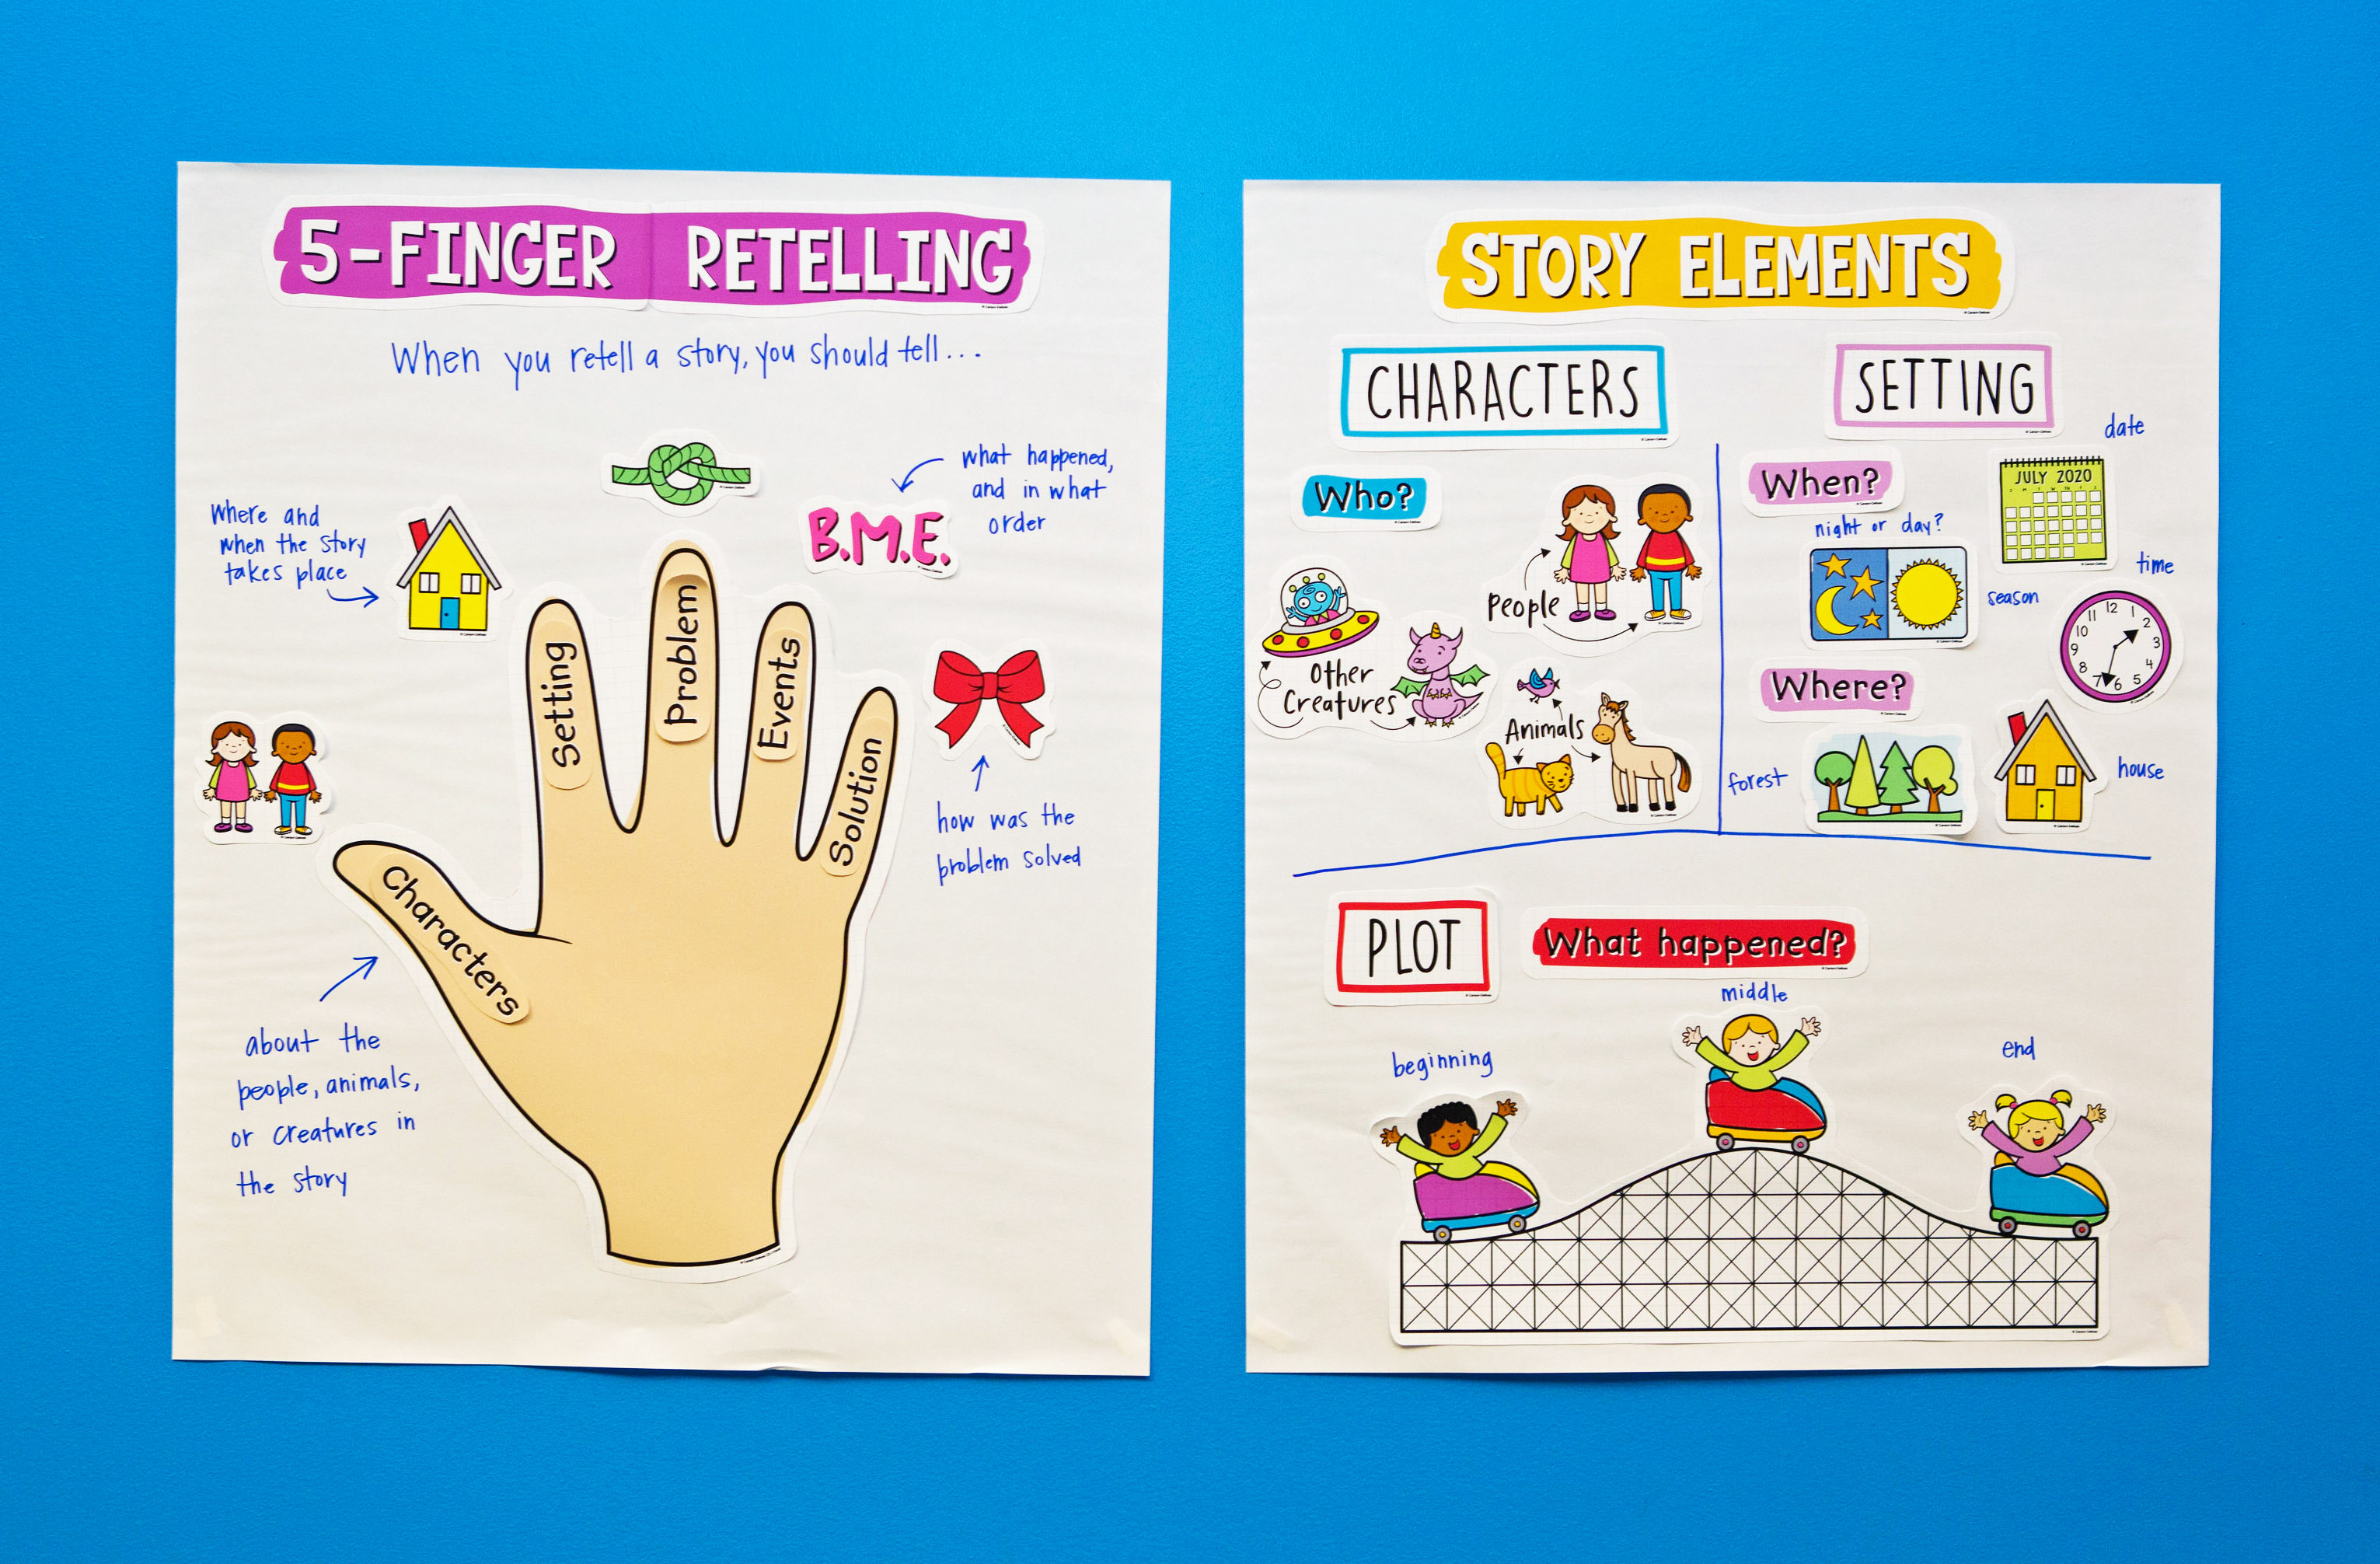
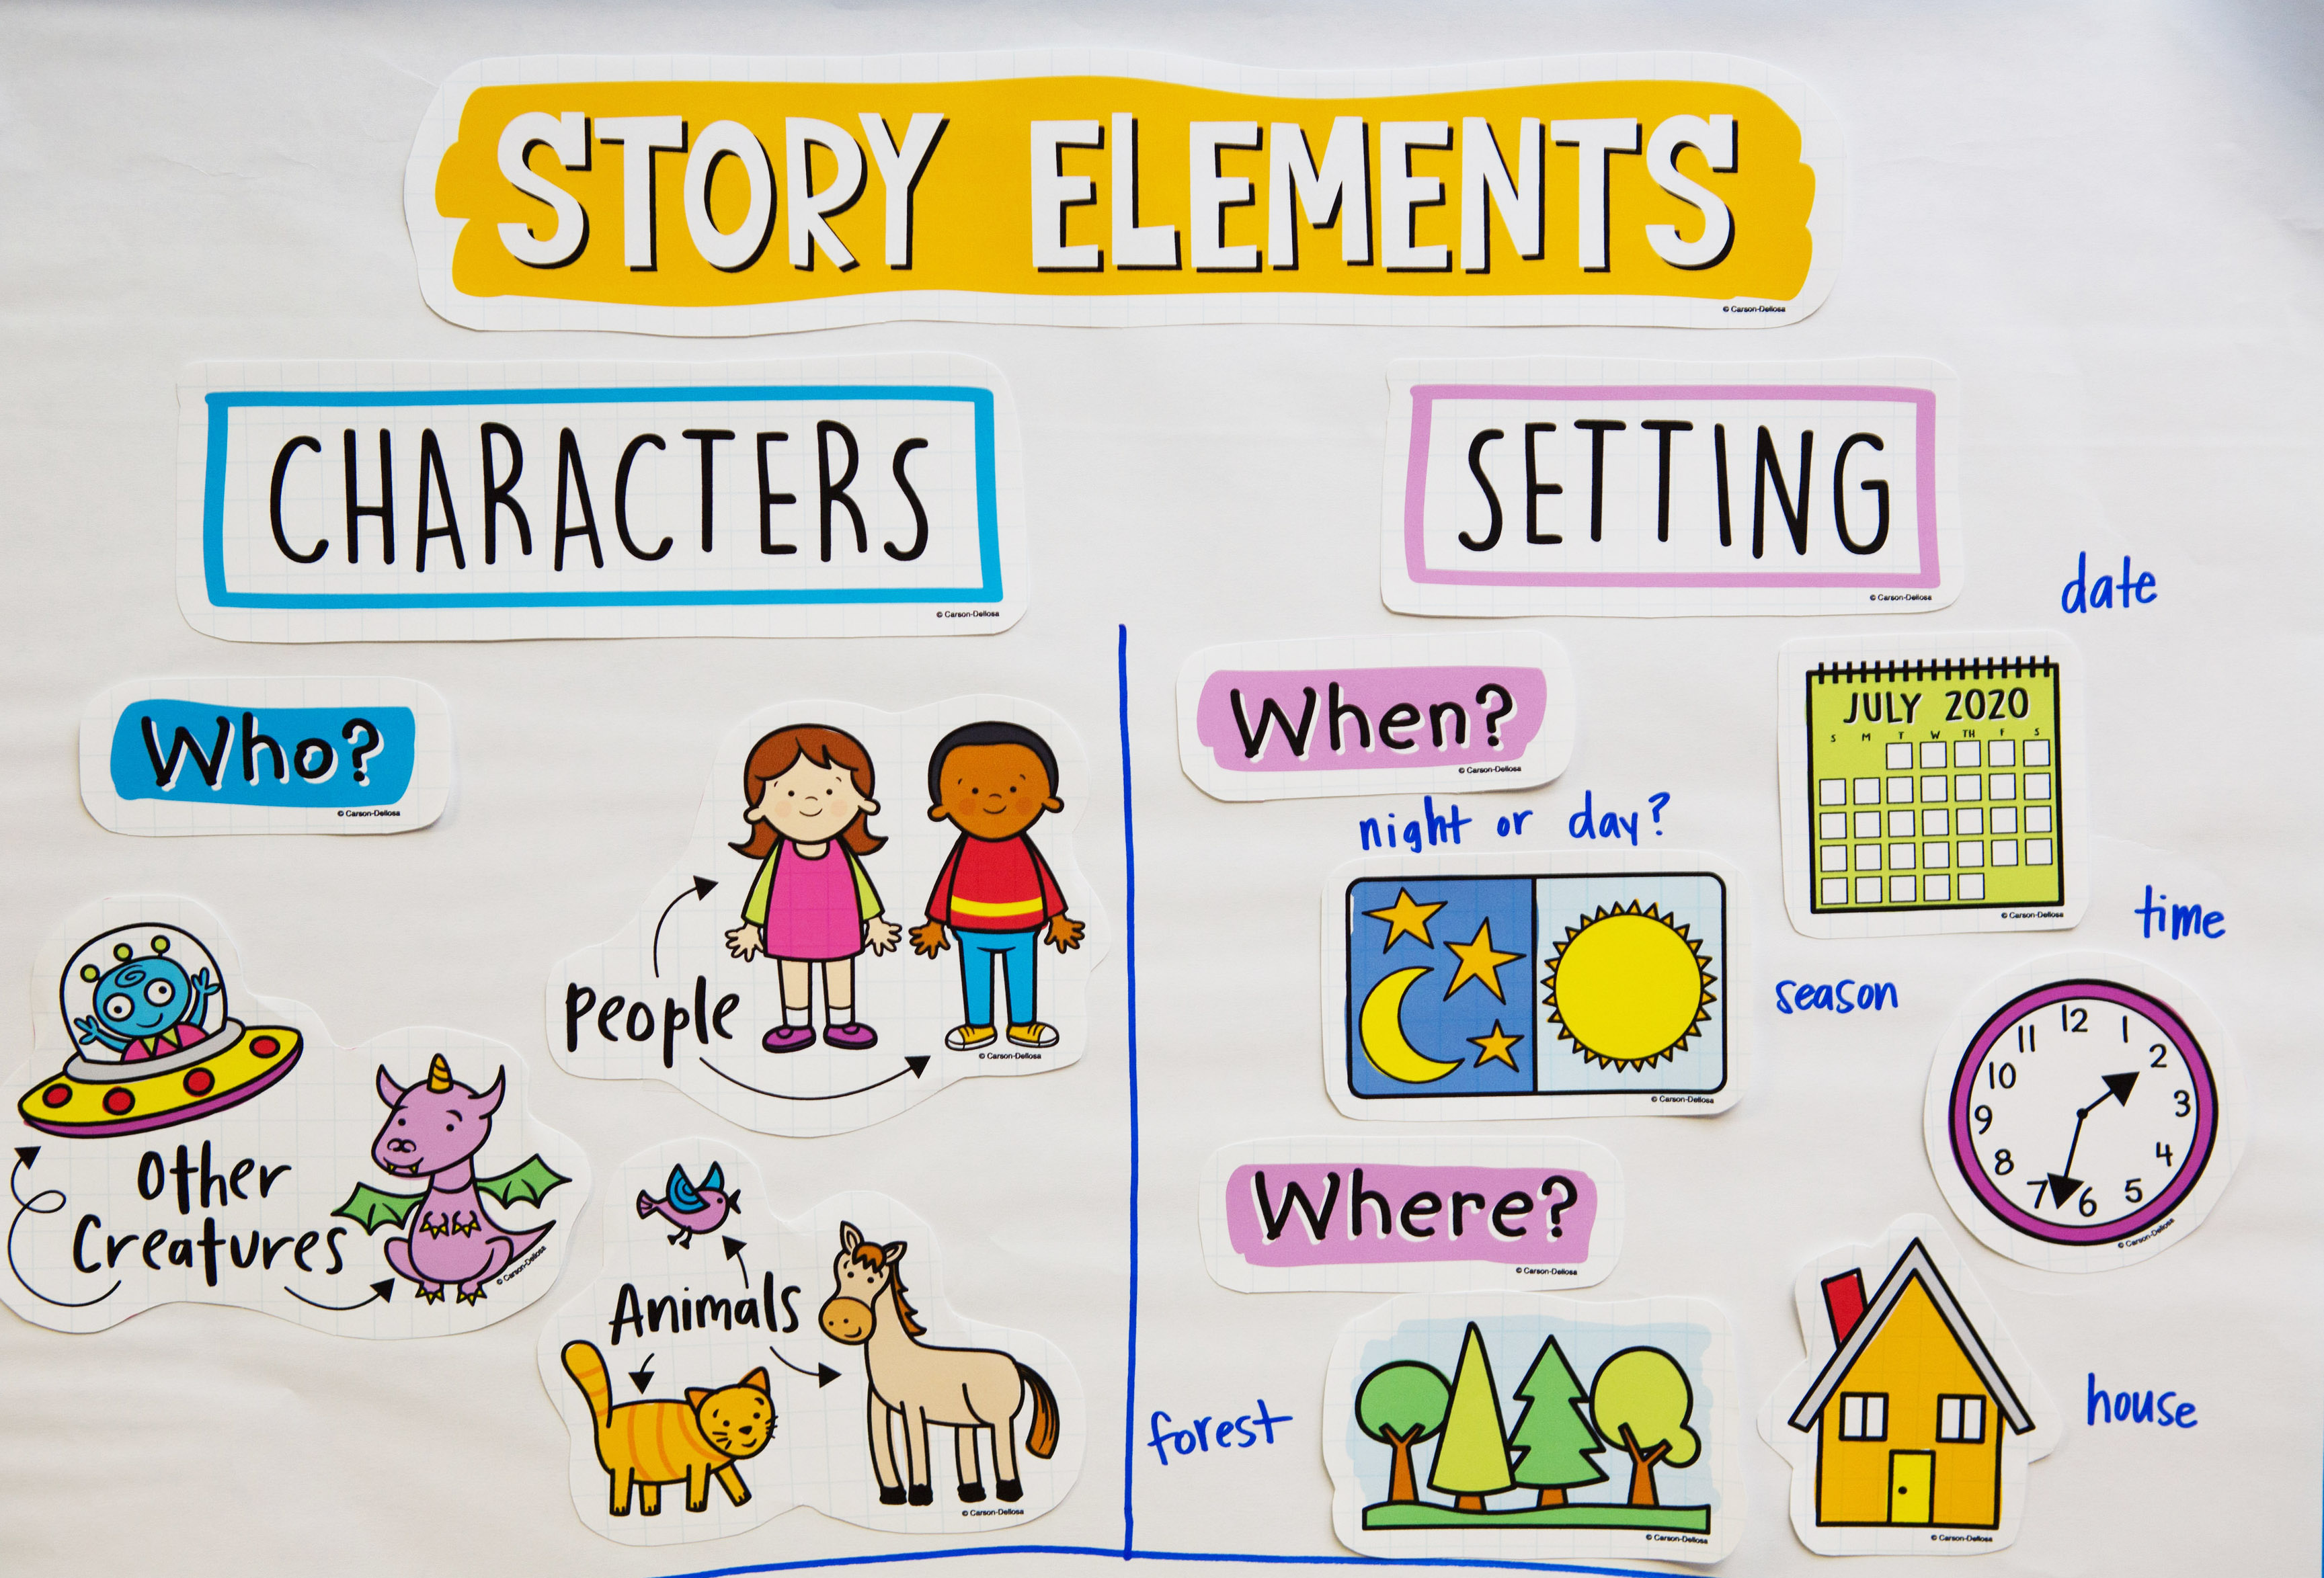
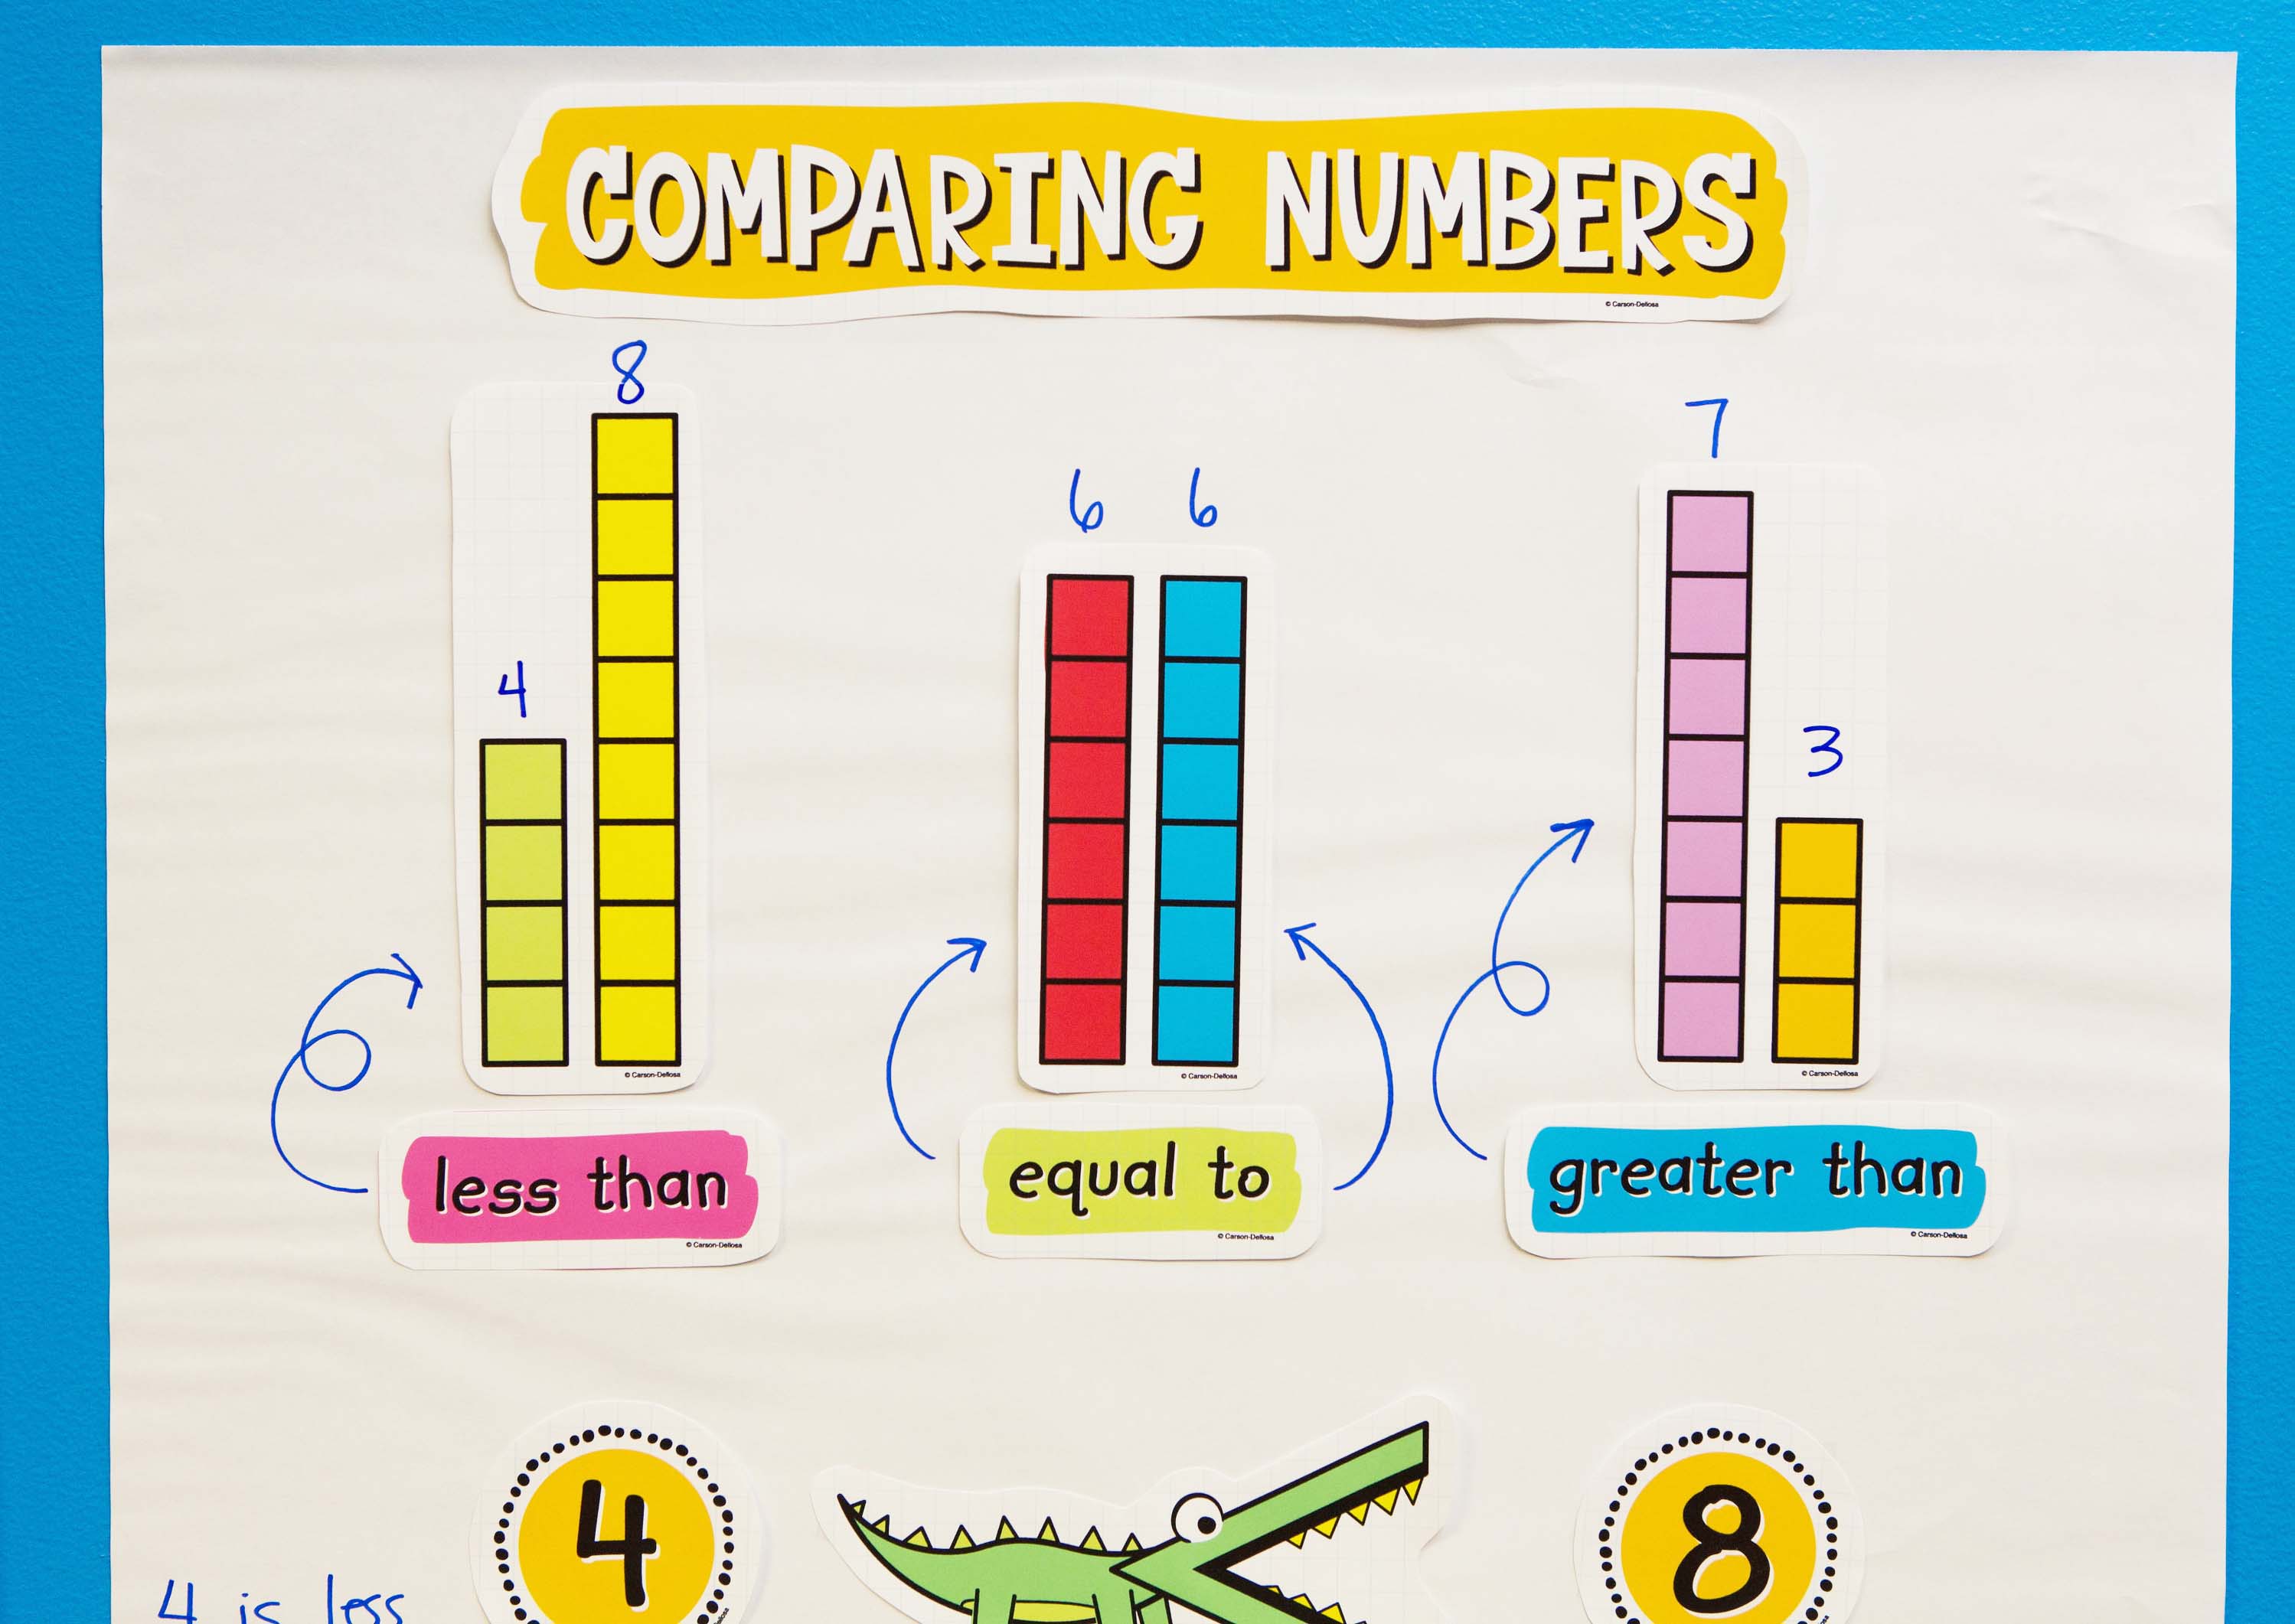
Simply stated, an anchor chart is a visual way to teach a topic. Create them at the beginning of new learning. A good anchor chart is a collaboration between you and your students. Arm yourself with a pile of markers and some chart paper, and get ready to teach. Invite students to participate. It can be just that easy.

Anchor charts are awesome!
Many teachers have a love-hate relationship with anchor charts. That used to be me. But once I learned a few tricks and got the knack of putting together an effective anchor chart, it quickly became a favorite teaching tool. The kids love them too. Anchor charts really are awesome! You can use them to teach anything.
My classroom had anchor charts everywhere. Some of the charts stayed up all year long, such as the “Choosing a Just-Right Book” chart that lived in my classroom library. My “Other Words for Said” anchor chart stuck around for months and was soon overcrowded as students enthusiastically added new words. But, others that I created (or hauled out of my supply closet) were displayed for only the period of time we studied the topic, such as my “Fun Figurative Language” or my “Really Long Division” anchor charts.
Anchor charts are easier than you think.
If you’re anything like me, creating an anchor chart might just as easily make you cry or smile. And I know: they can be difficult to organize and illustrate. We all want them to be Pinterest-perfect but feel like our handwriting and stick figures aren’t up to the task. Relax! With a little preplanning, anchor charts can become your favorite thing.
- Start with a clear goal. Then, chunk it into easily understood bits. That’s your framework.
- Always prepare the framework ahead of time. Keep it simple. Include only the title and the learning objective at the top. Consider how to illustrate the main points. Place the main points strategically, leaving plenty of space to add details or art as your students join in the discussion.
- Laminate the framework of the anchor charts so you can use them again. Then, use dry-erase markers as you and your students expand on the topic. At the end of the unit, take a photo to refer to when writing next year’s lesson plans. Then, wipe off your comments and store the chart in a safe place until you need it again.
- You can also create the framework with a common presentation program, allowing you to use pretty fonts and simple art or symbols. Then, project it onto the chart paper and trace it.
- Don’t put everything you know about a topic in the framework, just the most important points.
- Use different colors of markers, but not too many. Be consistent by writing your main points or strategies in one color and your sub-points in another color. Add richness with simple illustrations in other life-like colors.
- Think about the chart in sections. Place your title and/or goal at the top. Divide the rest of the sheet of chart paper into three or four sections according to the number of essential points that “tell the story.” You can think of the page in horizontal blocks or as a circle.


An anchor chart is one of the simplest ways to make learning interactive. They make both the teacher’s and the students’ thinking visible in ways that are easy to understand and remember. There’s nothing like a student-driven anchor chart to support learning and retention.

Chris Schwab, a former teacher with 12 years of experience teaching elementary special education, is an editor on the product development team at Carson Dellosa Education.

